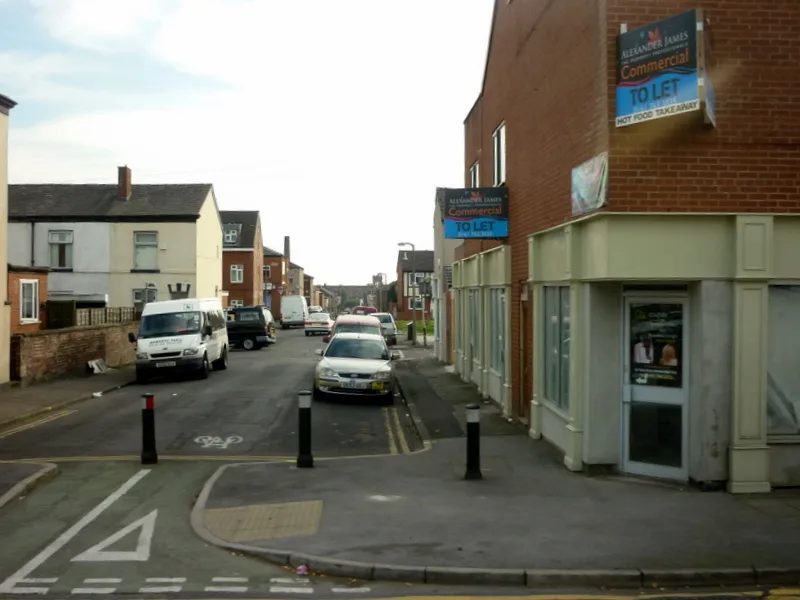

One in five Bury side streets is rated red, the council's worst condition band, and its DfT road grant has fallen 35% in two years. The figures in full.
One in five of Bury’s unclassified roads is in the worst condition band the council records. The figure is 20.6% for 2024, and unclassified roads are the residential streets most people actually live on.
They are also most of the borough. Bury has 629.2km of adopted road, and 499.8km of it is unclassified. That is 79% of the network. On our own calculation from those two figures, roughly 103km of Bury street sits in the red band.
The numbers come from the council’s own local highways maintenance transparency report for 2025/26. The Department for Transport requires every highway authority to publish one, so that taxpayers can see what the money buys. Bury’s is unusually detailed, and it shows three things at once: the side streets are the problem, the government grant is shrinking, and the council has quietly changed where it spends.
What “red” actually means
Red is not a description. It is a threshold, and it is a different threshold for different roads.
- A, B and C roads are surveyed by SCANNER laser vehicles. Green means a condition indicator under 40 and no action needed. Amber means 40 or more, and “maintenance may be required soon”. Red means 100 or more, and the road “should be considered for maintenance”.
- Unclassified roads get a Coarse Visual Inspection instead, carried out by accredited surveyors driving the network. Red means a wearing course indicator of 60 or more, the point at which “the section has exceeded the point where surface or structural repair should be considered”.
The council is explicit that only the red band is nationally specified for unclassified roads. There are no nationally agreed amber or green bands for them at all, which is why the report gives a red percentage for side streets and a full three-way split for main roads. The two sets of figures are not directly comparable, and nobody should read the side-street number as four times worse than the A-road one.
Two more limits worth knowing. Only 50% of the unclassified network is surveyed each year, in one direction, giving full coverage over two years. And from 2026/27 the method changes: authorities must use a supplier accredited to the new BSI PAS2161 standard, which sorts roads into five categories instead of three. This year’s figures will not compare cleanly with next year’s.
Five years of condition figures
The side-street line has actually improved. It peaked at 35.2% red in 2022, then dropped to 21.4% in 2023 and 20.6% in 2024. That is a real recovery, and it is the strongest thing in the report.
The main roads have gone the other way. A roads rated red rose from 3.7% in 2020 to 6.3% in 2024. B and C roads went from 2.6% in 2022 to 7.2% in 2024, close to a tripling in two years. Neither is a large share of the network, but both are trending the wrong way, and A and B roads carry the buses.
The government grant has fallen by a third
The report also publishes what the council is given, year by year.
| Year | DfT capital allocation | Total capital spend | Revenue spend |
|---|---|---|---|
| 2025-2026 (projected) | £3,692,000 | £7,926,829 | £2,590,300 |
| 2024-2025 | £4,098,200 | £7,520,436 | £2,376,006 |
| 2023-2024 | £5,691,320 | £9,419,071 | £3,104,749 |
| 2022-2023 | £3,593,000 | £6,697,600 | £3,336,763 |
| 2021-2022 | £3,435,000 | £5,951,000 | £1,797,923 |
| 2020-2021 | £3,555,413 | £6,245,396 | £3,977,733 |
The DfT allocation for 2025/26 is £3,692,000, down from £5,691,320 two years earlier. That is a fall of just under £2m, or 35%.
Total capital spending has held up better, because the council puts in its own money. The report says the capital figures include £3.3m a year from Bury Council’s own resources, plus City Region Sustainable Transport Settlement funding. Separately it records a commitment to invest an additional £30m for highway maintenance over and above the DfT budget, across 2017/18 to the end of 2025/26. Spread over those nine years, that is the same £3.3m a year.
Put plainly: for every £1 the government gives Bury for its roads, the council is now finding close to another £1 itself.
Where the resurfacing is going instead
This is the part that has changed, and the report states the reason in a single line: “we have revised how funding is distributed across the various classifications of highway”, based on the council’s own assessments, input from elected representatives and a review of condition data.
Compare what the council did in 2024/25 with what it plans for 2025/26:
| Resurfacing | 2024/25 done | 2025/26 planned |
|---|---|---|
| A, B and C roads | about 4.8km | about 1.25km |
| Unclassified roads | about 6.5km | about 8.5km |
| Total | about 11.3km | about 9.75km |
Main road resurfacing is being cut by roughly three quarters, and side street resurfacing raised by about a third. The total falls, because the grant fell.
That is a defensible choice on the condition data, since the side streets have far more red in them. It is also the choice that explains why some A and B roads are getting visibly worse. The council’s own resurfacing programme for 2026/27 backs it up: of the roads named for later in the year, almost all are residential, including Hampson Mill Lane and Lakeside in Bury, Queens Drive and Rochester Drive in Prestwich, Delph Lane in Radcliffe and School Lane and Square Street in Ramsbottom.
The exceptions are the big ring road jobs happening now. Peel Way is being resurfaced this week, overnight from Monday 7 to Friday 11 September, and Rochdale Old Road was done at the end of August. Full details are on our Bury roadworks and travel page.
Potholes: about 10,000 a year, and falling
The council fills roughly ten to twelve thousand potholes a year, and the trend is down:
- 2024-2025: 10,201
- 2023-2024: 10,963
- 2022-2023: 11,738
- 2021-2022: 10,327
- 2020-2021: 11,451
For 2025/26 it plans to fill about 10,000. A falling pothole count is not automatically good news or bad news, since it can mean better surfaces or fewer inspections finding them. Bury’s split between preventative and reactive work has not moved at all: 75% preventative and 25% reactive, every single year since 2020.
What else the council says it will do this year
The 2025/26 plan, in its own words:
- resurface approximately 9.75km of roads
- surface dress approximately 7.5km of roads
- improve 30 footways
- upgrade more than 2,000 lanterns to LED on main traffic routes
- replace or refurbish two foot or cycle bridges
- strengthen a major retaining wall supporting the A56
- replace the bearings on a structure in a key town centre location
- fill approximately 10,000 potholes
Around 70% of Bury’s 21,000 street lights have already been converted to LED, with more than 14,500 units replaced across three phases.
One further item is worth watching. The council says it is “looking to be a lane rental authority”, which would let it charge utilities and contractors a daily rate to dig up the busiest roads at the busiest times. The stated aim is to push them towards no-dig techniques, joint working and off-peak hours. No timetable is given.
What it means for you
- If your street is unclassified, it is more likely than not to be the council’s priority now, rather than the main road you drive to work on. That is a deliberate change, made this year.
- If you use the A and B roads, expect them to get worse before they get better. Planned resurfacing on them drops from about 4.8km to about 1.25km this year.
- A red rating is not a pothole. It means the surface has passed the point where repair should be considered, not that the road is dangerous today.
- Report defects rather than waiting. Reactive repairs are driven by the council’s safety inspections, and the report says those are prioritised by risk.
- Next year’s figures will look different for a technical reason. The new PAS2161 standard splits roads into five bands rather than three from 2026/27.
What we could not confirm today
- The report does not carry a publication date, so we cannot say when it went up.
- It gives the 2025/26 surface dressing target as 7.5 miles in one section and 7.5km in another. Those are not the same distance. The 2024/25 figure is given as about 9 miles and around 85,000 square metres, which is consistent with miles, so the kilometre figure looks like the error. We have asked nobody, and the council has not corrected it.
- The network table records just 2.8km of cycleway against 1,194km of footway. The report does not define what it counts as a cycleway, so this figure should not be read as the length of Bury’s cycling network.
- The condition percentages are published to 2024. There is no 2025 figure yet.
Sources
- Bury Council, local highways maintenance transparency report 2025-2026, for every figure above.
- Bury Council, highway resurfacing schemes, for the named roads in the 2026/27 programme.
- Bury Council, road works and closures, for the Peel Way dates.
Have your say