
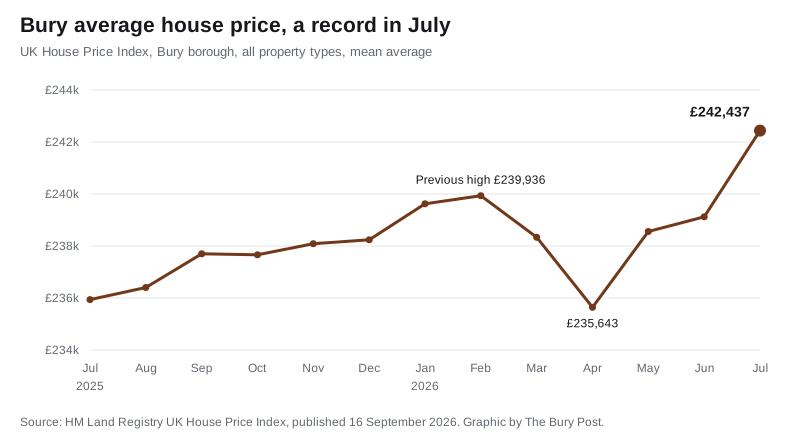
Bury's average house price rose £3,315 in July to a record £242,437, the biggest monthly rise in Greater Manchester. It is up 2.8% on a year, behind the region.
The average home in Bury sold for £242,437 in July 2026. That is the highest figure the borough has ever recorded, and the first time it has gone above £240,000.
HM Land Registry published the figures in its UK House Price Index on Wednesday. The July average was £3,315 higher than June’s, a rise of 1.4% in one month. No other Greater Manchester borough rose as fast.
The previous record was £239,936 in February 2026. Prices then slipped to £235,643 in April before climbing back.
A strong month, a middling year
Over twelve months the picture is less striking. Bury’s average is £6,500 higher than in July 2025, a rise of 2.8%.
That is slower than the North West as a whole, where prices rose 4.4% to £221,445. It puts Bury seventh of Greater Manchester’s ten boroughs for annual growth.
| Borough | Average, July 2026 | Change in a month | Change in a year |
|---|---|---|---|
| Trafford | £400,688 | +0.8% | +9.6% |
| Bolton | £204,379 | +0.7% | +5.9% |
| Oldham | £217,171 | +0.9% | +4.7% |
| Rochdale | £209,389 | 0.0% | +4.5% |
| Stockport | £317,913 | +1.2% | +4.2% |
| Wigan | £194,551 | -0.5% | +3.9% |
| Bury | £242,437 | +1.4% | +2.8% |
| Manchester | £252,309 | +0.9% | +1.2% |
| Salford | £229,462 | -0.3% | +0.3% |
| Tameside | £209,723 | -1.2% | -0.1% |
Bury remains the fourth most expensive borough in Greater Manchester to buy in, behind Trafford, Stockport and Manchester. Across England the average was £293,479.
Houses rose, flats did not
Every type of house gained value over the year. Flats were the exception.
| Property type | Average, July 2026 | Change in a year |
|---|---|---|
| Detached | £412,842 | +2.3% |
| Semi-detached | £270,383 | +3.3% |
| Terraced | £202,368 | +3.3% |
| Flat or maisonette | £134,160 | -0.7% |
Semis and terraces did best, both up 3.3%. The average flat is now worth slightly less than a year ago.
First-time buyers paid an average of £213,927, up 3.0% on the year. Homeowners moving on paid £284,321 on average, up 2.5%. Buyers with a mortgage paid £246,200 and cash buyers £231,710.
How to read these figures
- This is a mean average, not a median. A handful of expensive sales pulls it up, so the typical home in Bury is likely to sell for less than £242,437.
- The index is adjusted for the mix of homes sold. A month with lots of detached sales does not on its own push the figure up, which is why it is a fairer guide to prices than a simple average of sales.
- Recent months get revised. Sales take weeks to reach the Land Registry, so the latest figures rest on fewer transactions and usually change. May, for example, was first published as £238,266 and now stands at £238,556. July’s record could move either way when August’s figures come out.
- One strong month is not a trend. The February record was followed by two months of falls.
What it means for you
If you are selling in Bury, the market has recovered its spring dip and gone past its previous high. A 1.4% monthly rise is unusual, though, and the annual rate of 2.8% is the better guide to how values are moving.
If you are buying your first home, terraces are the obvious entry point at £202,368 on average, and flats are cheaper still at £134,160 after a small fall.
If you are remortgaging or checking what your home is worth, compare it with homes of the same type. The gap between a Bury flat and a detached house is more than £278,000.
For prices by town, including the gap between Prestwich and Radcliffe, see our Bury house prices page. If you are moving into the borough, our guides to council tax bands and bin collection days cover the running costs.
Source: HM Land Registry UK House Price Index for Bury, the North West, England and each Greater Manchester borough, July 2026 release.
Have your say