
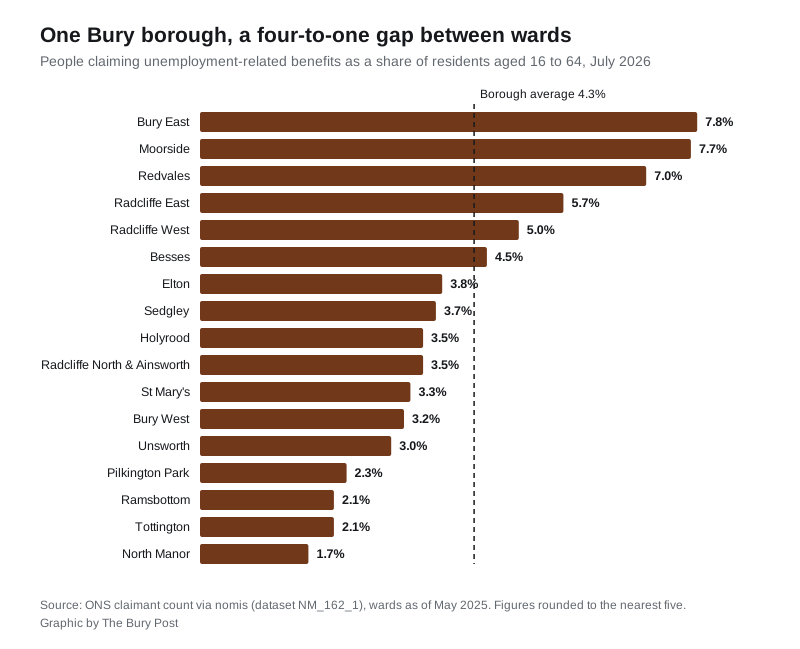
Bury's claimant count is 4.3%, 4th lowest in Greater Manchester. Inside the borough the range runs from 1.7% in North Manor to 7.8% in Bury East.
5,270 people in Bury were claiming unemployment-related benefits in July, or 4.3 per cent of residents aged 16 to 64, according to ONS figures published through nomis. That is 70 more than a year ago, a rise of 1.3 per cent, and it leaves Bury with the fourth lowest rate of Greater Manchester’s ten boroughs.
That borough figure hides a range of more than four to one.
Ward level data for the same month puts Bury East at 7.8 per cent and North Manor at 1.7 per cent. Three wards are above 7 per cent. Six are below 3.
The wards, highest to lowest
| Ward | Claimants | Rate |
|---|---|---|
| Bury East | 715 | 7.8% |
| Moorside | 595 | 7.7% |
| Redvales | 550 | 7.0% |
| Radcliffe East | 440 | 5.7% |
| Radcliffe West | 380 | 5.0% |
| Besses | 325 | 4.5% |
| Elton | 270 | 3.8% |
| Sedgley | 295 | 3.7% |
| Holyrood | 260 | 3.5% |
| Radcliffe North and Ainsworth | 255 | 3.5% |
| St Mary’s | 255 | 3.3% |
| Bury West | 200 | 3.2% |
| Unsworth | 205 | 3.0% |
| Pilkington Park | 135 | 2.3% |
| Ramsbottom | 160 | 2.1% |
| Tottington | 130 | 2.1% |
| North Manor | 90 | 1.7% |
The wards add to 5,260 against a borough total of 5,270. Everything in this release is rounded to the nearest five, so small gaps like that are expected rather than an error.
The geography is not subtle. Bury East, the highest of the seventeen, is the ward that contains the town centre itself, including the Mill Gate Shopping Centre and the market. Moorside and Redvales sit immediately around it. The three lowest are Ramsbottom, Tottington and North Manor, on the borough’s northern and western edges. Radcliffe sits in between, its two main wards fourth and fifth.
Ward figures for Bury only begin in January 2026, so there is no year-ago ward comparison to make. Over the seven months there are, the pattern has widened rather than levelled:
- Bury East up 55, from 660 to 715
- Radcliffe East up 45, from 395 to 440
- Radcliffe North and Ainsworth up 40, from 215 to 255
- North Manor down 10, from 100 to 90
- Radcliffe West down 15, from 395 to 380
Younger claimants rose, but by less than nationally
Bury’s total barely moved in a year. Underneath it, one age group did.
- 16 to 24: 1,095, up 55 on July 2025, a rise of 5.3 per cent
- 25 to 49: 3,120, down 30, a fall of 1.0 per cent
- 50 and over: 1,055, up 45, a rise of 4.5 per cent
Nationally the young claimant count rose far faster. Across the UK it went from 302,835 to 332,335, a rise of 9.7 per cent, and across the North West it rose 10.0 per cent. Bury’s increase is roughly half of both.
Set against the rest of Greater Manchester, only Bolton had a milder rise in claims from 16 to 24 year olds. The table below also shows where Bury sits on the all-ages rate.
| Borough | 16-24, July 2025 | 16-24, July 2026 | Change | All-ages rate |
|---|---|---|---|---|
| Bolton | 1,830 | 1,865 | +1.9% | 5.2% |
| Bury | 1,040 | 1,095 | +5.3% | 4.3% |
| Wigan | 1,535 | 1,630 | +6.2% | 3.6% |
| Rochdale | 1,635 | 1,740 | +6.4% | 5.9% |
| Manchester | 4,710 | 5,065 | +7.5% | 6.0% |
| Trafford | 775 | 835 | +7.7% | 3.0% |
| Salford | 1,860 | 2,060 | +10.8% | 5.0% |
| Oldham | 1,890 | 2,110 | +11.6% | 6.6% |
| Stockport | 1,055 | 1,220 | +15.6% | 3.0% |
| Tameside | 1,405 | 1,630 | +16.0% | 4.8% |
Only Stockport, Trafford and Wigan have a lower overall rate than Bury. For comparison, the UK rate is 3.9 per cent and the North West’s is 4.1.
What the claimant count is, and is not
This is not the unemployment rate, and treating it as one overstates some places and understates others. The claimant count records people receiving Jobseeker’s Allowance or claiming Universal Credit while required to look for work. It therefore includes people who are working, on low enough earnings to still be under work search conditions, and excludes people who are out of work but not claiming.
Two more things matter when reading a July figure. The numbers are not seasonally adjusted, and July is the month school and college leavers arrive, which is why a July figure should only be compared with another July. And everything is rounded to the nearest five.
What it means for you
If you are claiming in Bury, the council’s NeighbourHub has moved and expanded, and is now open at 18 Union Arcade in the Mill Gate Shopping Centre. The council says it brings employment and skills support, adult learning courses, health help and digital access into one town centre unit.
If you left school or college this summer, you are in the group these figures moved most, and a July count always includes that year’s leavers. Bury Adult Learning Service holds its annual open day on Saturday 5 September, open to residents from across the borough.
If you want to check a ward yourself, the figures come from nomis dataset NM_162_1, the ONS claimant count, which publishes down to ward level and updates monthly.
For the wider picture on Bury, see our reports on house prices across the borough and this summer’s GCSE results.
Update, 17 September 2026. The ONS has revised July’s figures since this story was published. Bury’s July 2026 count now reads 5,160 rather than 5,270, which puts it 40 below July 2025 instead of 70 above, and the ward figures above have moved with it. The figures in this article are left as first published. August’s figures, and the revised July numbers, are in our August claimant count report.
Have your say